Now that we learned how truly magnificent ActiveSupport::Notifications is in the previous post,
let's explore a RubyGem Chris, others and me have built around this: influxdb-rails.
Together with even more awesome Software Libre, it will help you to deep dive into your Ruby on Rails application performance.
- ActiveSupport::Notifications is rad! 💘
- Measure twice, cut once: App Performance Monitoring with influxdb-rails (this post)
- Let's build Software Libre APM together
Application Performance Monitoring (APM)
I'm not sure we have to discuss this at all anymore, but here is why I think I need application performance monitoring for my Ruby on Rail apps: I'm an expert in using the software I hack. Hence I always travel the happy path, cleverly and unconsciously avoid the pitfalls, use it with forethought of the underlying architecture. Because of that, I usually think my app is fast: perceived performance.
It's not what you look at that matters, it's what you see. – Henry David Thoreau
That is why I need someone to correct that bias for me, in black and white.
Free Software APM
The good folks at Rails bring the instrumentation framework. InfluxData deliver a time series database. Grafana Labs make a dashboard builder. All we need to do, as so often, is to plug Software Libre together: SUCCE$$!
InfluxDB + Grafana == 🧨
I assume your Rails development environment is already running on 127.0.0.0:300. Getting InfluxDB and Grafana is a matter
of pulling containers these days. You can use this simple docker-compose configuration for running them locally.
# docker-compose.yml
version: "3.7"
services:
  influx:
    image: influxdb:1.7
    environment:
      - INFLUXDB_DB=rails
      - INFLUXDB_USER=root
      - INFLUXDB_USER_PASSWORD=root
      - INFLUXDB_READ_USER=grafana
      - INFLUXDB_READ_USER_PASSWORD=grafana
    volumes:
      - influxdata:/var/lib/influxdb
    ports:
      - 8086:8086
  grafana:
    image: grafana/grafana:7.4.5
    ports:
      - 4000:3000
    depends_on:
      - influx
    volumes:
      - grafanadata:/var/lib/grafana
volumes:
  influxdata:
  grafanadata:
A courageous docker-compose up will boot things and you can access Grafana at http://127.0.0.1:4000 (user: admin / password: admin).
To read data from the InfluxDB container in Grafana, leave the /datasources
InfluxDB defaults alone and configure:
URL: http://influx:8086
Database: rails
User: grafana
Password: grafana
influxdb-rails: 🪢 things together
The influxdb-rails RubyGem is the missing glue code for making your app report metrics into the InfluxDB.
Plug it into your Rails app by adding it to your bundle.
bundle add influxdb-rails
bundle exec rails generate influxdb
The next time you boot your Rails dev-env it will start to measure the performance of your app. Now comes the interesting part, interpreting this data with Grafana.
Understanding Ruby on Rails Performance
Every time you use your dev-env, influxdb-rails will write a plethora of performance data into InfluxDB.
Let's look at one of the measurements so you get an idea of what's going on. You remember the ActiveSupport::Notification
called process_action.action_controller from the previous post? Rails sends this message every time an action in
your controller has finished. It includes performance data for this action.
You should know this from somewhere: development.log! It contains the same information.
Started GET "/things" for 127.0.0.1 at 2021-03-25 15:20:14 +0100
...
Completed 200 OK in 5ms (Views: 4.1ms | ActiveRecord: 0.1ms | Allocations: 3514)
ThingsController#index took 5ms to finish overall, 4.1ms of those 5 in rendering, 0.1ms in querying the database.
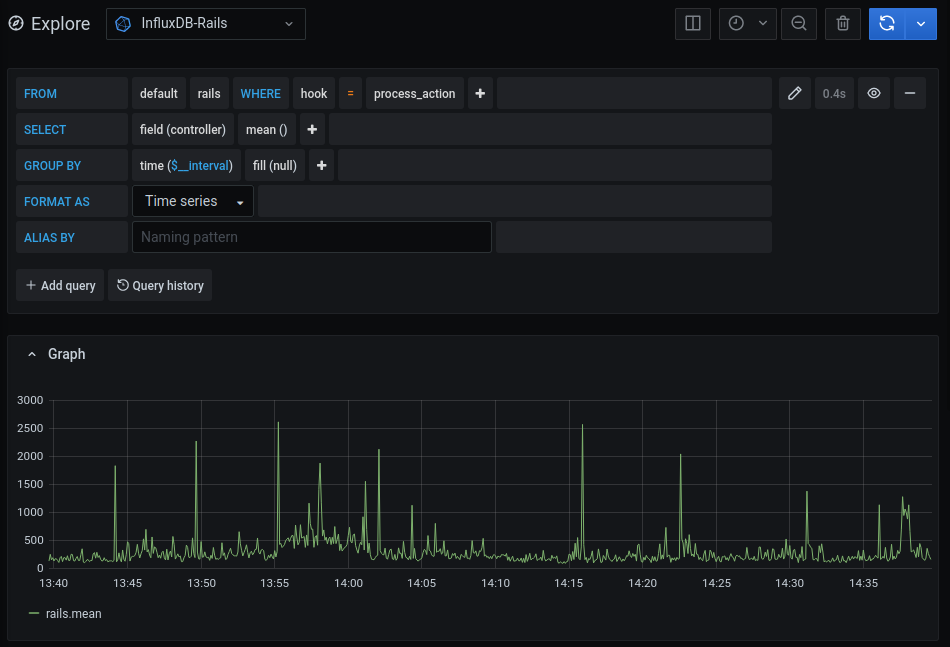
You find the same data for every request you make in your InfluxDB. Head over to http://127.0.0.1:4000/explore
and let Grafana plot it for you.

Only want to see how your views are performing? Change the field from controller to view.
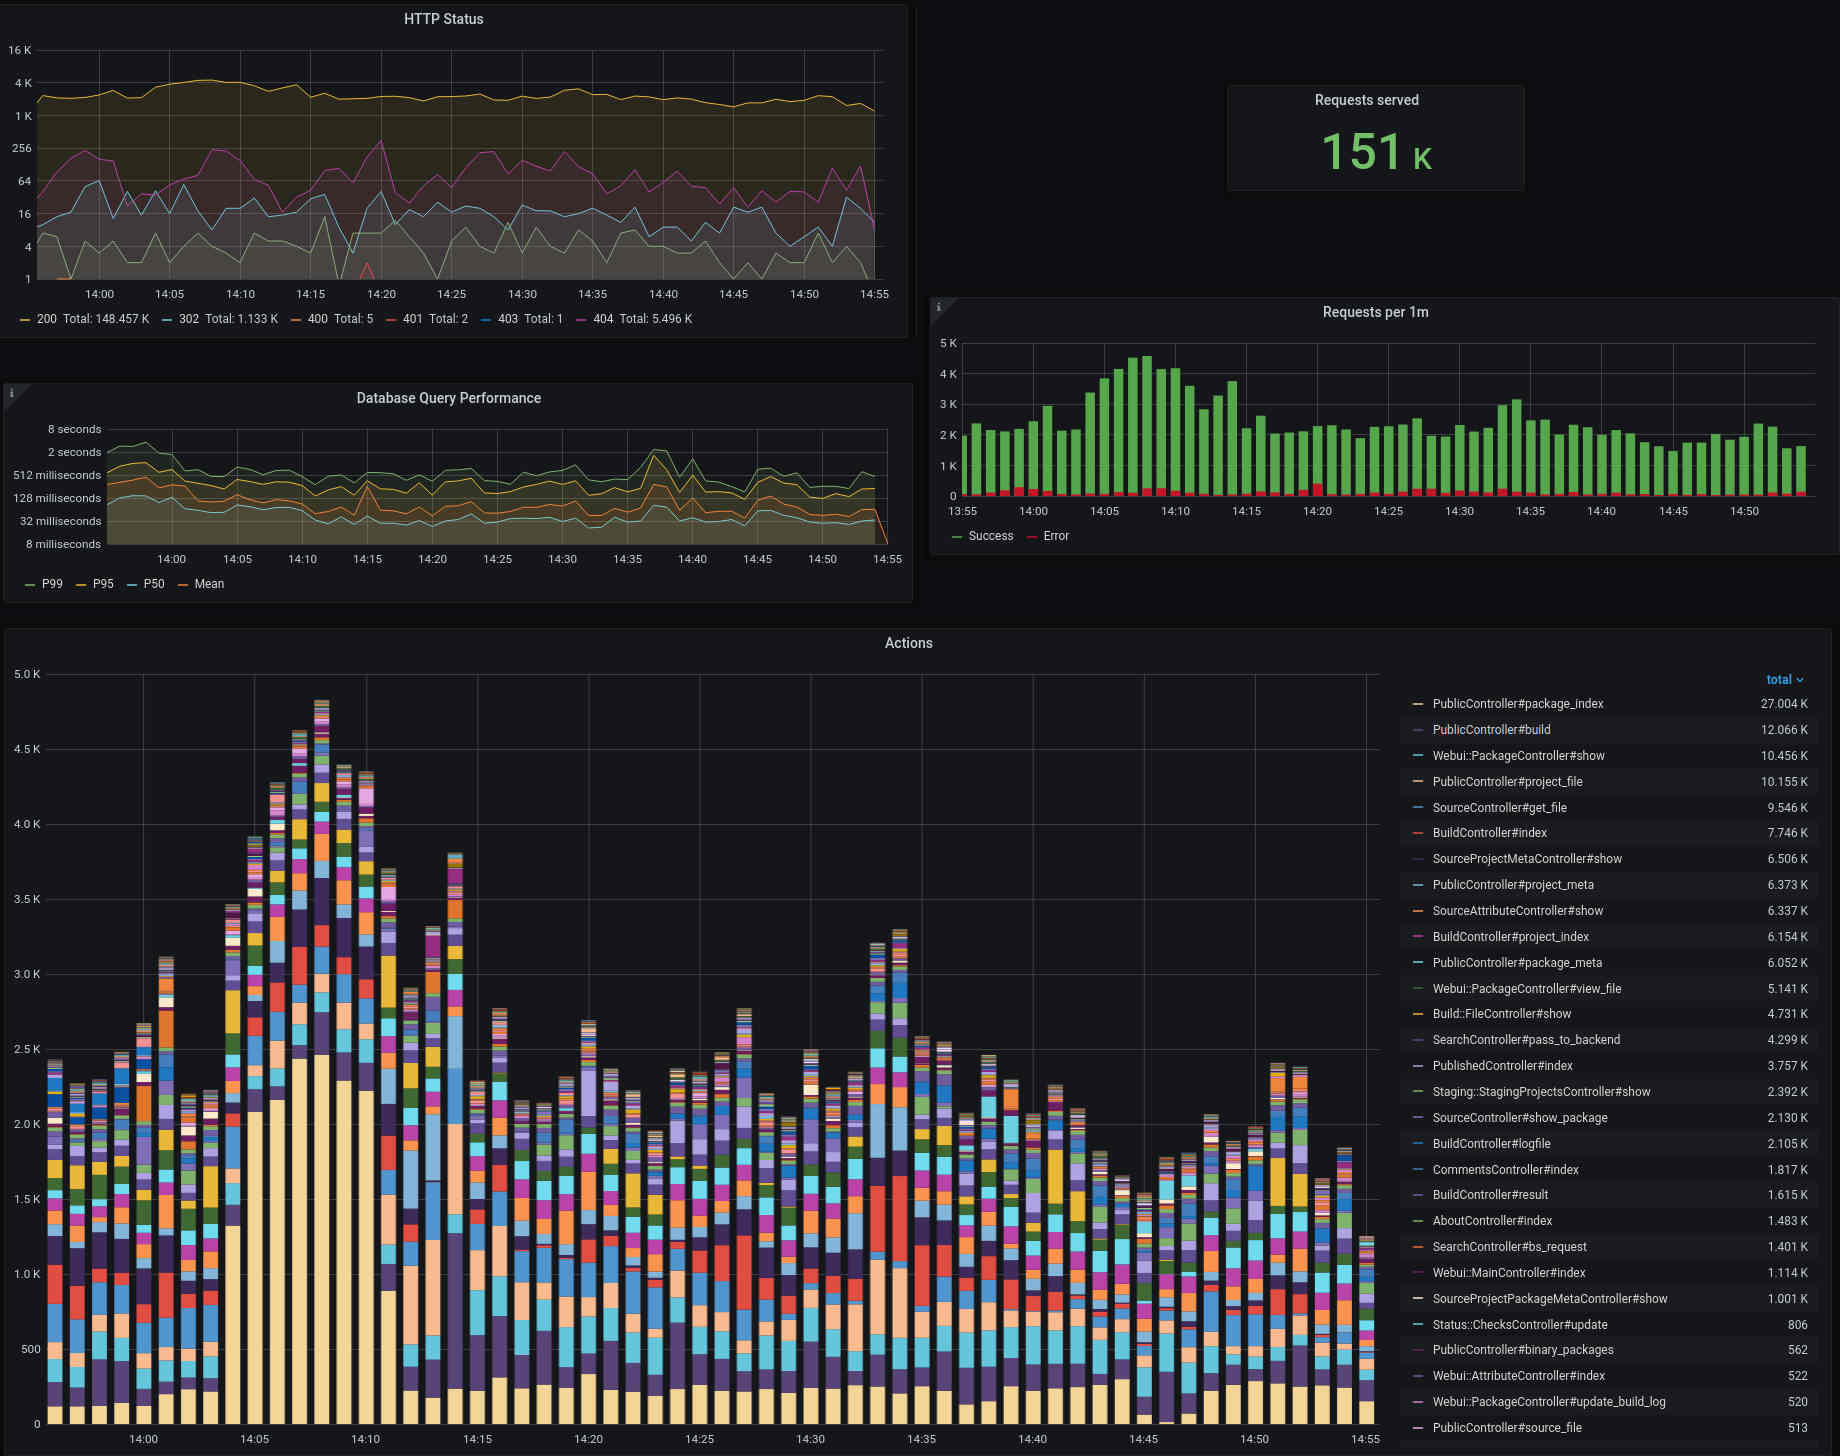
Magic 🪄 But this is only one out of many different ways to look at this measurement. All of the panels below use this one
measurement and the data it brings to visualize controller actions.

And this is only one measurement, influxdb-rails reports around a dozen.
Now I could send you off your way to learn about
ALL.
THE.
SOFTWARE.
involved, but that would be mean wouldn't it?
Ruby on Rails Dashboards
We, the Free Software community, are in this together! We collaborate on Ruby on Rails. We work together to make InfluxDB better. We cooperate to improve Grafana. Why not do the same for the dashboards to visualize Rails performance data? Let's collaborate! That is why we have build a couple of dashboards you can import. Just copy and paste the URLs into your Grafana.
- Ruby On Rails Performance Overview: Ruby On Rails Performance Overview
- Performance insights into individual requests: Ruby On Rails Performance per Request
- Performance of individual actions: Ruby On Rails Performance per Action
- HTTP Request Health: Ruby On Rails Health Overview
- ActiveJob Insights: Ruby on Rails ActiveJob Overview
- A list of the slowest requests: Ruby on Rails Slowlog by Request
- A list of the slowest actions: Ruby on Rails Slowlog by Action
- A list of the slowest queries: Ruby on Rails Slowlog by SQL
Play a little, I will tell you about all the nitty gritty details in the last post of this series: Let's build Software Libre APM together
Feedback?
Any criticism, remarks or praise about this post? Get in touch, I'm looking forward to your input!
